A figure worth 1,000 words
As the data integrity manager for the American Society for Biochemistry and Molecular Biology, I wear two hats. I investigate manuscripts submitted to and published in ASBMB journals for violations of ASBMB policies on publication ethics. (The ASBMB publishes the Journal of Biological Chemistry, the Journal of Lipid Research and Molecular & Cellular Proteomics.) I also educate authors regarding ethical issues in publishing and how best to handle them. The first role, albeit necessary, can be a roller coaster. I’ve heard a lot of different excuses from authors I’ve investigated for violations, such as erasing blemishes and bands, reusing data from different publications and cutting and pasting bands to create data that never existed. These excuses run the gamut from somewhat credible to incredible — although I haven’t yet heard that someone’s dog ate it.
Educating authors about ethics is vitally important. I realize that not everybody has the exposure I had as a Ph.D. student. My mentor instilled zero tolerance for misconduct in all of his trainees. There was also a great culture in the lab of sharing best practices for data presentation.
As a publisher, the ASBMB can help fill that gap for authors unfamiliar with these practices in figure presentation, since everyone may not have had this kind of exposure as a student or postdoctoral researcher. Learning best data-presentation practices doesn’t end with your formal training, though. I’m still learning, especially as publishing standards continue to evolve.
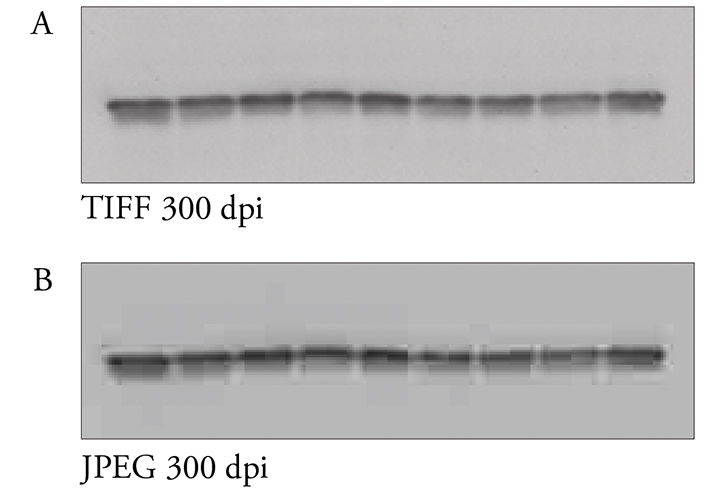 Figure 1: Images should be saved in TIFF format. The same image was saved at the same resolution of 300 dpi, but A was saved in TIFF format, while B was saved as a JPEG. Note the pixelation in B.
Over the next few months, I will be writing a series for ASBMB Today in which I will tackle different topics regarding images and figures and delve into ethical issues.
For now, I’ll start with the basics — how to best prepare manuscript figures for submission. A manuscript is like a picture book that tells a narrative (your research) with the aid of some pictures (your figures). In telling your story, you need to present the pictures in a clear manner so that reviewers and, eventually, readers will be able to understand and interpret your data. Here are a few pointers:
Read the instructions for authors
This may seem like a no-brainer, but you always should read the instructions to authors for the journal to which you plan to submit. The instructions contain valuable information about what the journal expects. This way, you avoid the frustration of having your manuscript sent back for formatting issues or because a reviewer can’t make out a blot.
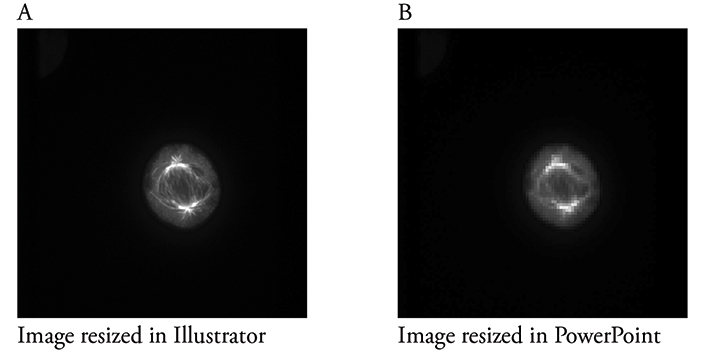 Figure 2: Figures should be created using appropriate software. The same image was resized, but A was resized in Adobe Illustrator, while B was resized in PowerPoint. Note the pixelation of the image in B. A free alternative to Adobe Illustrator is Inkscape.
Figure preparation begins at data acquisition
Preparing publication-quality figures begins during data acquisition, long before you have a story, much less know where to submit your work. Whether it’s scanning a film or taking a picture, overexposing or underexposing an image leads to loss of the fine details in the data. How can you tell your image is over- or underexposed? Take a look at the histogram. The histogram graphically displays the tonal distribution of an image by showing the number of pixels that are black, white and all the different shades of grey in between. Ideally, the pixels should be distributed throughout the range and not clustered at either end of the spectrum. While it is tempting to acquire a clean-looking image with no background or speckles, reviewers know what real data look like. Additionally, the images should be acquired at a minimum resolution of 300 dots-per-inch.
Save images using loss-less compression
Scientific images should be saved in the TIFF format, because it uses a loss-less compression algorithm to save your data. Avoid the JPEG format because it uses an algorithm that results in loss of data (lossy compression). Lossy-compression algorithms approximate the original data, which can result in parts of your data being discarded. Although saving an image as a JPEG may save you computer disk space, the problems that this compression method may introduce, by essentially throwing out information, are not worth the benefit of more disk space or faster upload time (Figure 1).
Prepare figures using appropriate software
PowerPoint is an attractive option for generating your figures, but avoid PowerPoint. The reason is that PowerPoint is designed for an onscreen resolution of 72 dpi and not print, which requires at least 300 dpi. Resizing images using PowerPoint can lead to loss of data, since it applies a lossy compression (Figure 2). Adobe Illustrator and Inkscape are good options for preparing figures.
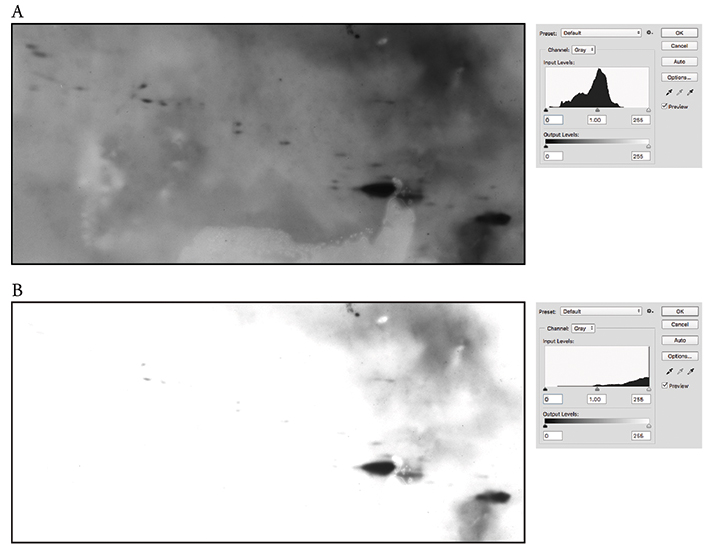 Figure 3: Avoid excessive manipulation. The original unmanipulated scan is shown in A along with the accompanying histogram. In B, the brightness and contrast were adjusted excessively. Note the absence of background, the disappearance of some spots and the shift in the accompanying histogram.
Avoid excessive manipulation
This topic will be covered in more depth in future articles, but, in brief, you should manipulate your image as little as possible when preparing the figures for publication. Your final image should be a true representation of the film or image when you captured the original. Aggressively contrasting your image or adjusting the levels to reduce the background may draw questions from reviewers and readers. Again, take a look at the histogram to make sure you are staying within acceptable limits. That pesky band or spot that you find troubling actually may be very informative for readers. It could indicate the performance of a certain antibody, or it could be a differentially modified form of your protein of interest (Figure 3). Importantly, those bands or spots are the actual data! Hiding or omitting them misrepresents your experimental results to the reader.
Check your figures by printing them
It’s a good idea to print out your figures before submitting them. If you have a hard time viewing your images, chances are so will the reviewers.
Submit!
And try to relax until the reviews come in.
Enjoy reading ASBMB Today?
Become a member to receive the print edition four times a year and the digital edition monthly.
Learn moreGet the latest from ASBMB Today
Enter your email address, and we’ll send you a weekly email with recent articles, interviews and more.
Latest in Science
Science highlights or most popular articles
Blood glycome possibly predicts lifespan
Researchers at the University of Santiago de Compostela show that total serum N-glycome can predict mortality independent of traditional risk factors.

Building a better model for drug delivery across the blood–brain barrier
Industry and academic scientists collaborated to develop a rat with humanized iron-transport receptors, enabling research into iron homeostasis and drugs that cross the brain’s barrier.

Fat synthesis enzyme crucial for milk fat and newborn growth
Researchers found that a deficiency of the fatty acid synthesis enzyme stearoyl-CoA desaturase-1 reduced mammary gland function during lactation and caused low birth weight in newborns that were fed milk from enzyme-deficient glands.
Flipping lipids and slime molds
A dull first job nearly pushed JBC associate editor Todd Graham out of science. Then a slime mold project changed his path. Now, he studies membrane biology and reflects on discovery, persistence and mentoring through uncertainty.

How smelling death alters worm behavior
Researchers have found that the roundworm C. elegans can smell death, and it changes how the worms behave, reproduce and age.

A chance encounter with the lab
Payton Stevens never planned to become a pancreatic cancer researcher. A temporary job set him on a path from rural Kentucky to leading research on Wnt signaling and metastasis, where he now pairs discovery with mentorship and science advocacy.