June 21–25 | Virtual
Teaching science with big data
Teaching science with big data
June 21–25
This international meeting guides faculty on how to teach using web-based, free-access large data sets. How big is "big data"? Data that is so large, fast or complex that it's difficult or impossible to process using traditional methods.
Who should register: This workshop is for faculty who would like to get started teaching science with open source big data applications. Participants are not expected to have expertise in computer programming, Jupyter Notebooks or RStudio.
Join us to learn these valuable teaching skills. Sessions will be recorded and made available to registrants for on-demand viewing.
Sponsored by the ASBMB and the International Union of Biochemistry and Molecular Biology.
Organizers
Schedule
All times listed are U.S. Eastern Daylight Time (GMT-4)
Keynote
Workshop: Investigating evolutionary relationships through sequence and cluster analysis
In this workshop we show teachers how to use Jupyter Notebooks to create tailored BLAST searches, perform cluster analysis and visualize connectivity between datasets.
Break/Networking
Spotlight talks selected from abstracts
NOAA database resources
Faculty talk
Toryn Poolman, University College London
Workshop: Visualization of Top 8000’s protein dataset using RStudio
Apply different R visualization packages and display different design themes using R so that students can select type of visualization and use R to help them communicate an end result.
Break/Networking
Spotlight talks selected from abstracts
NOAA database resources
Faculty talk
Thomas Chen, Association for Computing Machinery U.S. Technology Policy Committee
Workshop: Pedagogy of working with climate big data using RStudio
Instructors will learn an approach they can use to guide students through working with large datasets that will increase their quantitative reasoning. We will compare climate data from different time periods to explore what is so different about current climate change.
Break/Networking
Spotlight talks selected from abstracts
NOAA database resources
Faculty talk
Angie Hilliker, University of Richmond
Workshop: Visualization of Top 8000’s protein dataset
Instructors will learn to load protein datasets into Jupyter Notebook, analyze them using Biopython and visualize the results.
Break/Networking
Spotlight talks selected from abstracts
NOAA database resources
Faculty talk
Arjun Krishnan, Michigan State University
National Oceanic and Atmospheric Administration (NOAA) environmental data and visualization resources
Workshop: Resources and implementation plans
Janet Macaulay, Monash University
Participants develop plans for implementation and find community of resources.
Break/Networking
Workshop: Development plans report out
Bios
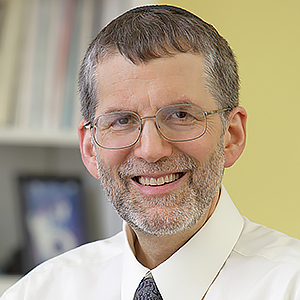
Michael Lauer
Michael Lauer, M.D., is the deputy director for extramural research at the National Institutes of Health, where he serves as the principal scientific leader and advisor to the director of the NIH on all matters relating to the substance, quality and effectiveness of the NIH extramural research program and administration. He received education and training at Rensselaer Polytechnic Institute, Albany Medical College, Harvard Medical School, Harvard School of Public Health and the NHLBI’s Framingham Heart Study. He spent 14 years at Cleveland Clinic as professor of medicine, epidemiology, and biostatistics. During his tenure at the clinic, he led a federally funded internationally renowned clinical epidemiology program that applied big data from large-scale electronic health platforms to questions regarding the diagnosis and management of cardiovascular disease. From 2007 to 2015 he served as a division director at the National Heart, Lung and Blood Institute, where he promoted efforts to leverage big data infrastructure to enable high-efficiency population and clinical research, and efforts to adopt a research funding culture that reflected data-driven policy. He has received numerous awards including the NIH Equal Employment Opportunity Award of the Year and the Arthur S. Flemming Award for Exceptional Federal Service in recognition of his efforts to grow a culture of learning and accountability.
Alon Friedman
Alon Friedman, Ph.D., is an associate professor in the School of Information Science at the University of South Florida. He is an interdisciplinary researcher with a focus on visualization theory and the visualization of data. He uses different theoretical perspectives to organize data through a visualization lens. His current projects include Visual Peer Review and 'Peirce's sign theory as an open-source R package.’ His work has been published in the Journal of Information Visualization, Education and Information Technologies, and Technology, Pedagogy and Education. He has developed courses to teach open-source R and visual analytics to students across academic disciplines. Alon is an active member of the open R community member since 2010.

Wally Novak
Wally earned his Ph.D. in Chemistry and Chemical Biology from UCSF in the lab of Patsy Babbitt where he studied bioinformatics and enzymology. He went on to an NIH postdoctoral fellowship in structural biology at Brandeis University with Greg Petsko and Dagmar Ringe before landing at Wabash College. He holds the William J. and Wilma M. Haines Professorship in Chemistry and is currently serving as the Chair of the Division of Mathematics and Natural Sciences.
Catherine O'Reilly
Catherine O’Reilly is a professor at Illinois State University, where she teaches in the Department of Geography, Geology and the Environment. She has long been committed to providing undergraduate students with authentic experiences in science, both in the classroom and through research projects. She has been involved in Project EDDIE since its inception, and is currently leading one of grants that supports the project. Her research focuses on aquatic ecosystems, with an interest in human impacts and climate change. She has been involved in several large-scale collaborative projects through the Global Lake Ecological Observatory Network, as well as over a decade of research on Lake Tanganyika, East Africa. Her work has been reported in media such as the BBC, New York Times and National Geographic. Dr. O’Reilly has a B.A. from Carleton College and a Ph.D. from the University of Arizona. As part of the 2007 Intergovernmental Panel on Climate Change, Dr. O’Reilly shares the Nobel Peace Prize with Al Gore and 2000 other scientists.
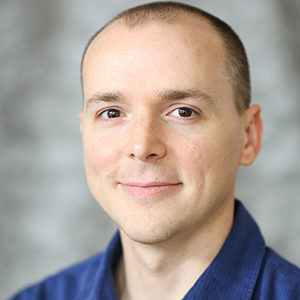
Charlie Weiss
Charlie Weiss teaches chemistry and scientific computing at Augustana University in Sioux Falls, South Dakota. He earned his B.A. from Carleton College and Ph.D. from Northwestern University, and his areas of specialty have historically been catalysis and reaction mechanisms. In recent years, he has taken an interest in the processing, analysis, and visualization of experimental data using the Python programming language and Jupyter notebooks. In 2017, Charlie began teaching a scientific computing course aimed at providing chemistry students advanced data analysis skills and recently made his textbook for the course, Scientific Computing for Chemists, freely available on GitHub under a Creative Commons license. He has a particular interest in data visualization and digital graphics and is a proponent of using and teaching open source software and utilizing open educational resources.
Bekkah Lampe
Bekkah Lampe has a background in informal science education and has worked at educational institutions in Maryland, Virginia, California, Kansas and North Carolina. She has been with the NOAA Office of Education since 2018 and manages the NOAA Education resource collections and the NOAA Education presence at educational conferences across the country.

