Focus on exposure
In past columns, I’ve made the point that figure preparation begins at data acquisition, but I haven’t really explained my reasoning in depth. So here, I’ll fill you in. Once you’ve snapped your picture or exposed your Western blot, that image becomes the version of record for your experiment. If the data you’ve collected is poor quality from the outset, your figure is already compromised.
One way to tell if you’ve nailed your image’s acquisition parameters is to look at your image’s histogram. Being able to interpret the histogram correctly can tell you if you can move forward with snapping the next picture of your mutant phenotype or if you need to tinker with the acquisition settings.
If you’re a digital photography aficionado, you probably are very familiar with histograms and the information they contain. Here’s a quick overview for those not yet accustomed to viewing them: A histogram of an image displays the distribution of pixels in the image, showing a graph of the number of pixels with a given intensity. For an eight-bit grayscale image, there are 256 possible intensities ranging from 0 (black) to 255 (white) for each pixel in the image. The histogram will not tell you how these pixels are distributed in space, just the distribution of the pixel intensity.
Ideally, you want the pixels to lie between the two extremes. This ensures that the fine details of your images are captured. If the pixels are clustered at either end, you’ve likely oversaturated or underexposed your image. For example, aggressively adjusting the black levels of an immunofluorescence image to reduce the background eliminates hallmarks of a true experimental image. On the other hand, oversaturation leads to loss of fine details and makes it impossible to quantify the signal. Why? From the point of view of the detector, i.e., the camera or film, once it has recorded the maximum amount of signal, it cannot register any more. If you’ve hit the limit on either end of the histogram, the detector won’t be able to tell you if a band or a cell feature is two times or 20 times more intense than a neighboring band or cell.
If you’re acquiring images on a microscope or gel-documentation system, the hard part already is done for you, because these instruments typically show you the histogram of the image you’ve just acquired. If you are using film, take multiple exposures of your blot to make sure you are within the linear range of the signal so you can properly quantify it. Once you’ve scanned your film, you can use either Photoshop or ImageJ to look at the histogram of your image. A telltale blip at either end of the histogram will tell you that you need to adjust your acquisition settings or use a different exposure of your film (Figure 1).
The histogram is also useful in telling you if your image has been overadjusted during figure preparation. After you’ve adjusted the brightness or contrast settings of your image, make sure to check the histogram one final time. If the histogram has shifted too far to the left or to the right, you’ve likely truncated the pixels that were at the ends of the distribution, and your image is now overly adjusted (Figure 2). If your histogram shifts too far to either end, the resulting image may raise flags with reviewers or the journal, because it may look like you’re trying to hide something. Remember, there’s no need to hide your true experimental results!
Doing your due diligence at the image-acquisition phase will save you time as you prepare your figures for publication, which could be months or even years after you initially acquired your data. Going back and repeating an experiment because an immunofluorescent image was underexposed or a band was completely blown out can be frustrating, to say the least, so use these tips to make the most out of your data.
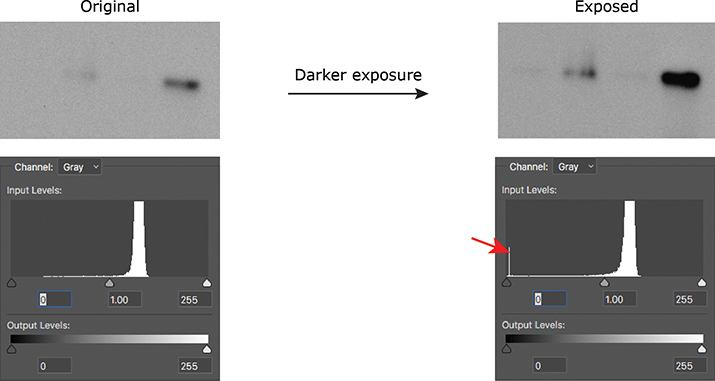 Figure 1. A spike on the histogram at 0 (red arrow) indicates that a Western blot was burned out (all black); a spike at 255 would have indicated that the blot was overexposed (all white).
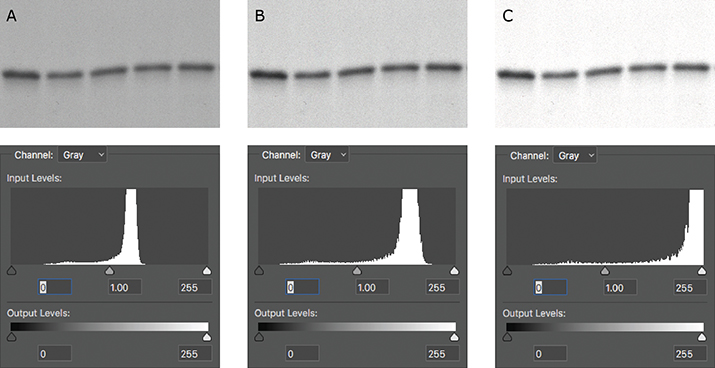 Figure 2. (A) The original capture of an immunoblot (B) Some of the levels were adjusted, but the pixels were still distributed between the two extremes. (C) The immunoblot was overly adjusted. The corresponding histogram shifted to the right, indicating that the majority of the pixels now were white.
Enjoy reading ASBMB Today?
Become a member to receive the print edition monthly and the digital edition weekly.
Learn moreGet the latest from ASBMB Today
Enter your email address, and we’ll send you a weekly email with recent articles, interviews and more.
Latest in Science
Science highlights or most popular articles
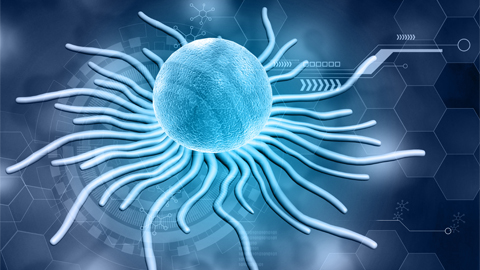
Immune cells can adapt to invading pathogens
A team of bioengineers studies how T cells decide whether to fight now or prepare for the next battle.
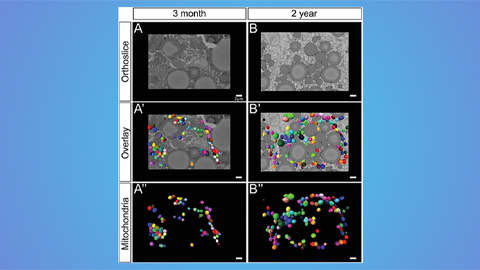
Hinton lab maps structure of mitochondria at different life stages
An international team determines the differences in the 3D morphology of mitochondria and cristae, their inner membrane folds, in brown adipose tissue.
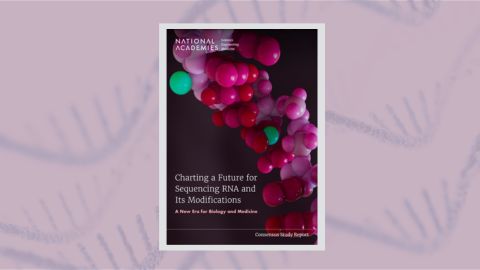
National Academies propose initiative to sequence all RNA molecules
Unlocking the epitranscriptome could transform health, medicine, agriculture, energy and national security.
From the journals: JLR
What can you do with artificial lipoproteins? A new key to angiogenesis. Flavonoids counteract oxidative stress. Read about recent papers on these topics.
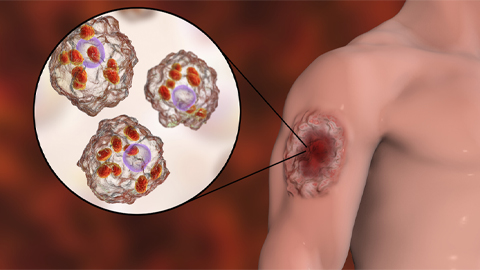
Iron could be key to treating a global parasitic disease
A study has found that leishmaniasis causes body-wide changes in iron balance, leading to red blood cell damage.

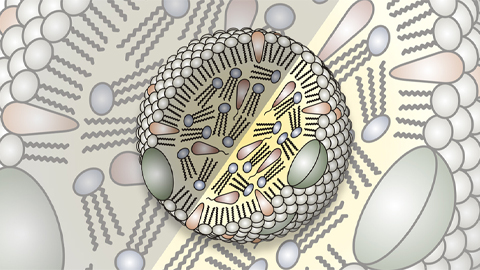
Environmental DNA is everywhere
The ability to extract trace bits of DNA from soil, water, and even air is revolutionizing science. Are there pitfalls?